Trying (and failing) to predict the overlap columns
Responsible play note: this is hobby stats and code. Lotteries are luck-first. Nothing here predicts a draw. If it stops being fun, step away.
The columns in question
For every draw we keep 20 little numbers, x1 … x20. Column xN says how many
numbers this draw shared with the draw N places before it:
xN(t) = | draw_t ∩ draw_{t-N} | (0 … 5)
So x1 = 0 means "the latest draw dodged every number of the previous draw", x7 = 2
means "it repeated two numbers from seven draws ago", and so on.
These columns already earn their keep as filters (we like combinations that don't pile onto recent draws). The tempting next step is to make them predictive:
Can we name the 5 or 6 columns most likely to be
0on the next draw?
If we could, we'd tighten the pool toward the shape the next draw is actually going to take. This post is the honest attempt — and the honest result.
First, a nicer way to look at it (the "diagonal" trick)
Stack all the overlaps into one matrix O(i, j) = |draw_i ∩ draw_j|. Then:
- Each x-column is a sub-diagonal of
O: fix the lagN, slide down the draws. - But you can also fix a single reference draw
pand read across its row —O(p, p+1), O(p, p+2), …— i.e. watch how that one draw's five numbers keep coming back in the draws that follow it. Predicting the next entry of that row is the "diagonal" idea: the earlier overlaps of drawptell you which of its numbers have already reappeared, so maybe they hint at the next one.
Here's the key realisation: both views reduce to the same question. xN = 0 just means
"the next draw avoided those five numbers." Whether you slide down a column or across a row,
you are ultimately asking whether individual numbers recur in a predictable way. So we
test that first — because if numbers have no memory, nothing built on top of them can.
Test 1 — the foundation: do numbers have a "due" effect?
For every number we measured P(it appears in a draw | delay since it was last drawn).
If there's a "due" force, this should rise with the delay. If numbers are memoryless, it's flat.
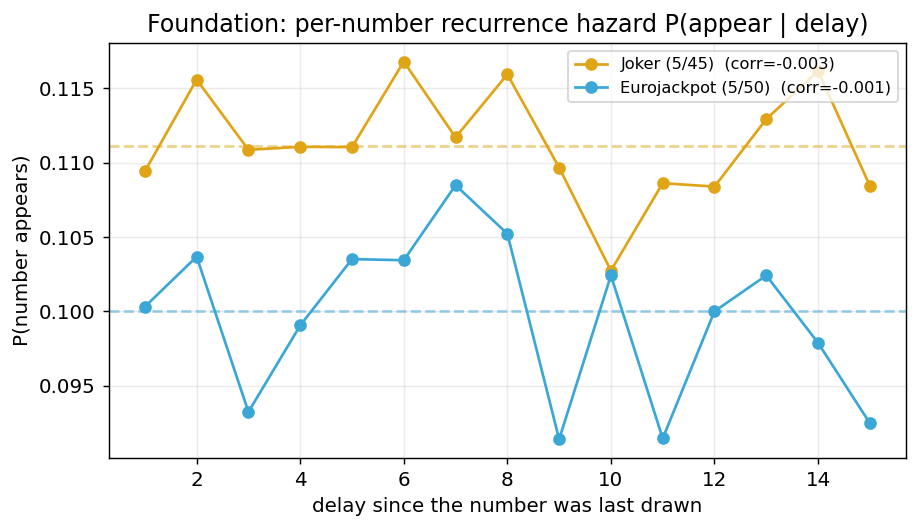
Flat. Joker sits on 1/9 ≈ 0.111 and Euro on 1/10 = 0.100, whatever the delay, and the correlation between delay and appearing is −0.003 (Joker) and −0.001 (Euro) — zero to three decimals. A number last seen 1 draw ago is exactly as likely to return as one last seen 12 draws ago.
That single result already tells us how the rest of the post has to end. But let's confirm it from every other angle, because that's the point.
Test 2 — is any column genuinely more "zero-prone"?
Per-column P(xN = 0), with 95% Wilson intervals, against the theoretical base rate
(C(n-5,5)/C(n,5) = 0.539 for Joker, 0.577 for Euro):
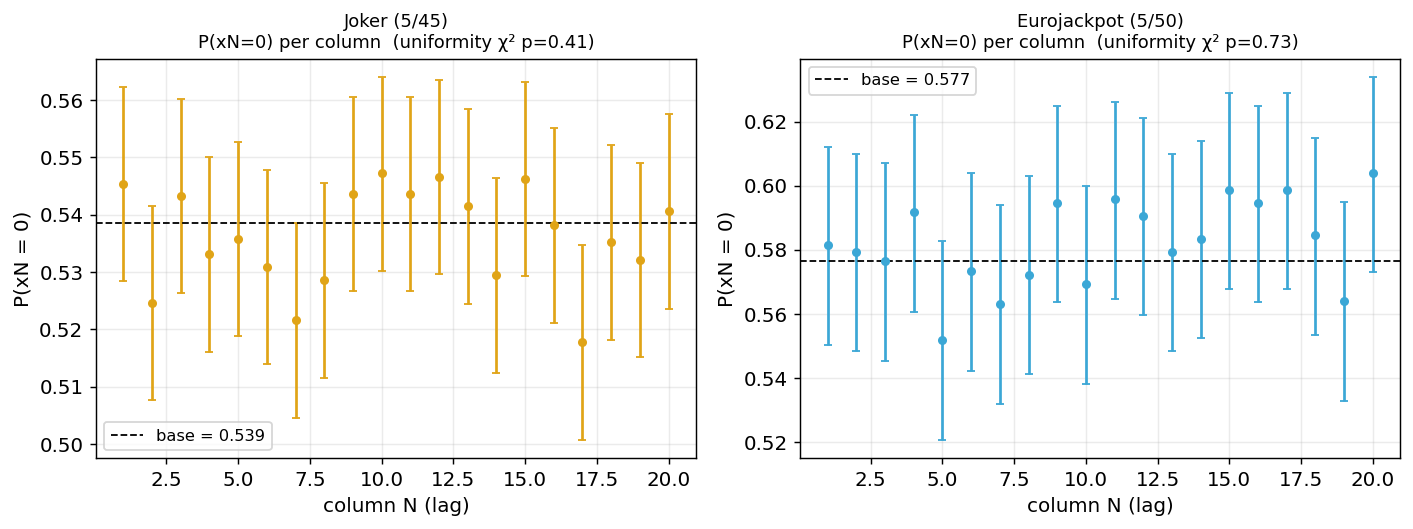
Every column's interval straddles the base line. A chi-square test that all 20 columns share one rate returns p = 0.41 (Joker) and p = 0.73 (Euro) — no evidence any column is special. The little spread you see (Euro wanders 0.55–0.60) is exactly what 20 noisy estimates look like; it does not survive the multiple-column test.
Test 3 — gap analysis (the one everyone reaches for)
The classic "it's due" move: look at the gaps between 0-events in a column and bet on the
ones overdue for another zero. But a memoryless (independent, coin-flip) process has a very
specific gap fingerprint — the Geometric distribution, P(gap = g) = (1-p)^{g-1} p. If the
observed gaps match it, there is nothing to time.
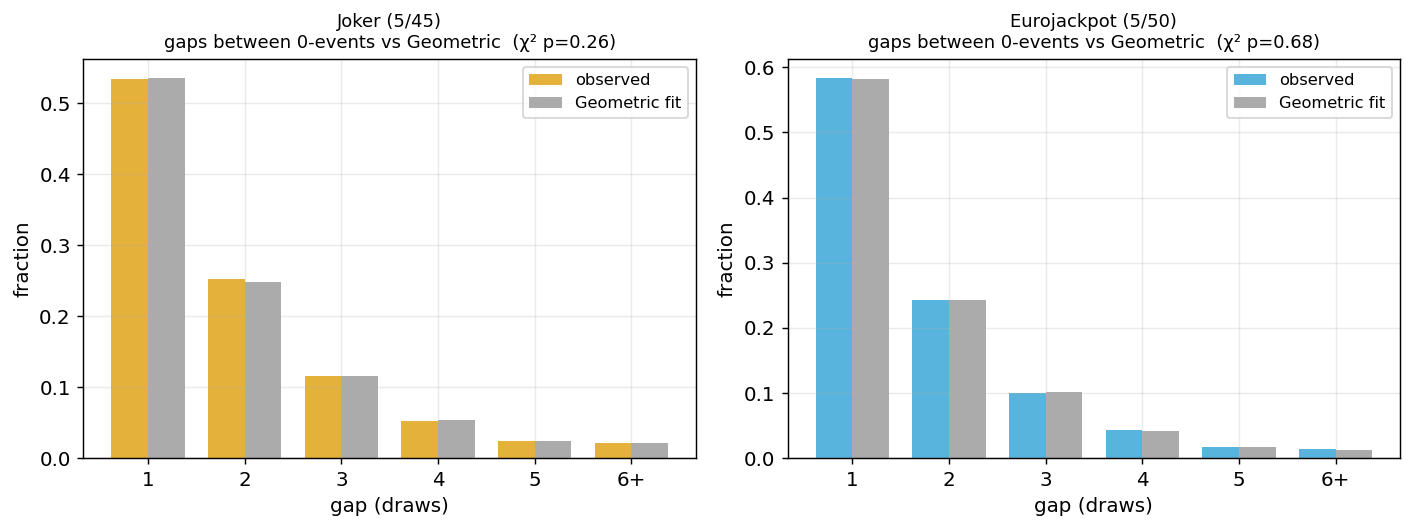
The observed bars and the Geometric fit sit on top of each other. A goodness-of-fit test gives
p = 0.26 (Joker) and p = 0.68 (Euro) — fully consistent with coin flips. The hazard is
flat too: the chance of a 0 is ~0.54 / 0.58 no matter how long since the last one. Gap
analysis has nothing to grab onto here.
Test 4 — Markov (order 1 and order 2)
Maybe the sequence carries structure. It doesn't:
| condition | Joker P(0) |
Euro P(0) |
|---|---|---|
| base rate | 0.539 | 0.577 |
given previous was 0 |
0.534 | 0.584 |
given previous was > 0 |
0.539 | 0.579 |
given previous two were 0,0 |
0.535 | 0.575 |
… 1,1 |
0.538 | 0.587 |
Every conditional lands back on the base rate. Order-1, order-2 — same story. (And since Test 1 is flat, higher orders can't rescue it.)
Test 5 — just try to predict it (walk-forward)
Enough theory — let's actually pick 6 columns each draw and count how often they come up 0
next, out of sample. Three pickers: longest current gap, highest historical rate, and the
per-number diagonal model (rank lags by ∏(1 − appearance rate) over the reference draw's
five numbers).
| picker (choose 6) | Joker hit-rate | lift | Euro hit-rate | lift |
|---|---|---|---|---|
| base rate (do nothing) | 0.539 | 1.00 | 0.577 | 1.00 |
| longest gap since last 0 | 0.534 | 0.99 | 0.570 | 0.99 |
| highest historical P(0) | 0.537 | 1.00 | 0.571 | 0.99 |
| per-number "diagonal" | 0.537 | 1.00 | 0.571 | 0.99 |
Not one clears the base rate; the Wilson lower bounds on the lift all sit below 1.0. The fancy diagonal model ties the do-nothing benchmark to three decimals.
Test 6 — the fair-null (the closer)
Finally the test we trust most. Shuffle the draw order hundreds of times, rebuild the x-columns from the (order-independent) overlap matrix, and rerun the best predictor. That gives the distribution of lifts you'd get from pure chance. Where does the real lift fall?
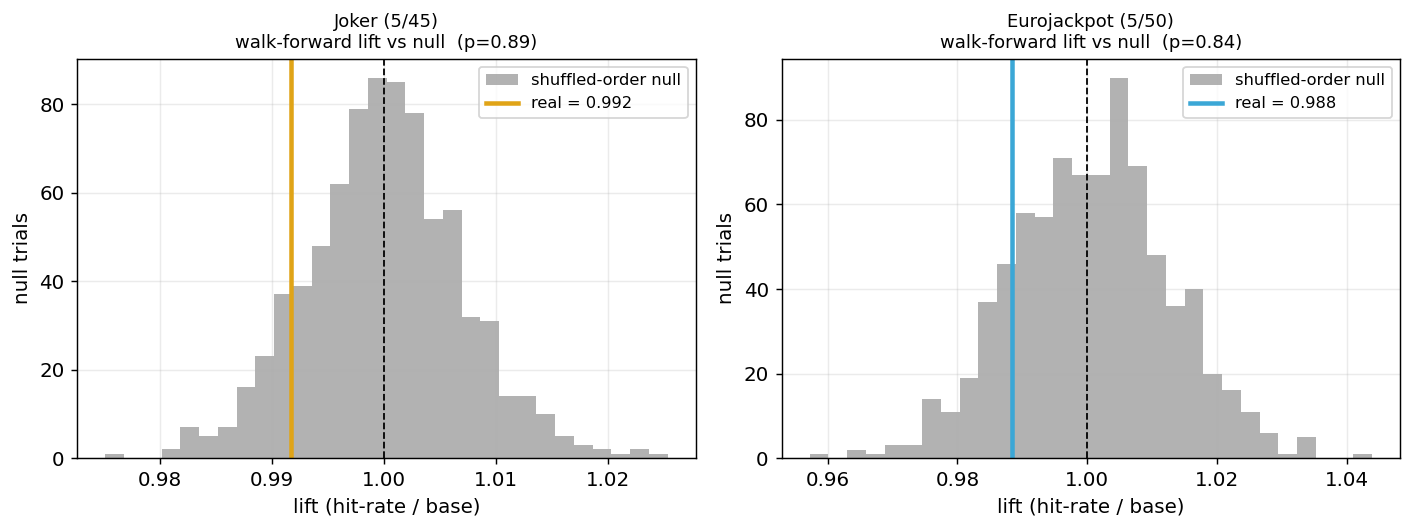
Dead in the middle — actually a hair to the left of 1.0. The real lift is 0.99 against a null centred on 1.00, with a permutation p = 0.89 (Joker) / 0.84 (Euro). The real sequence is indistinguishable from a shuffled one. There is no there there.
Test 7 — but that's exactly the ranking we use
Fair challenge: the lab has its own scoring functions for this —
calculate_gap_percentiles_across_columns (which ranks columns by a Prod = frequency ×
overdue-percentile score and feeds the "x-pattern" filter) and calculate_delaypercent (the
overdue/Pct_score diagnostic). If anything were going to beat the base rate, it should be the
tool we actually ship. So we pointed it at itself: each draw, rank the 20 columns by that "due"
score and check whether the top 6 (the ones the filter treats as most likely to hit 0)
actually do, next draw.
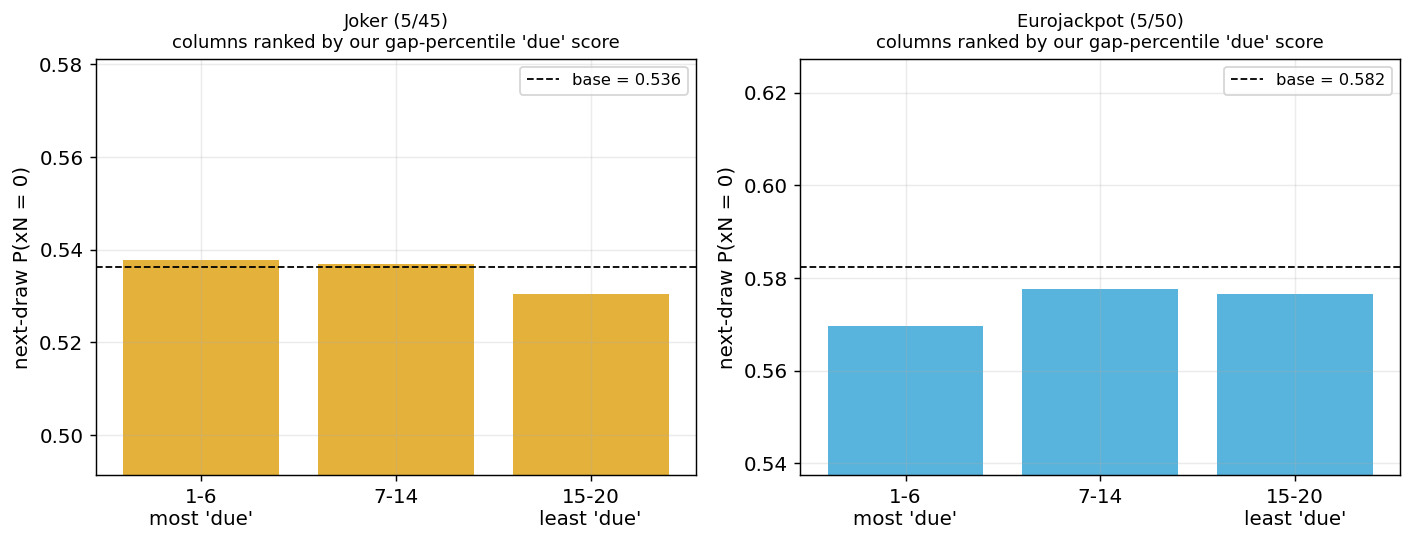
Flat. The 6 "most due" columns come up 0 at lift 1.00 (Joker) / 0.98 (Euro) — no better than
the 6 "least due" or the base rate. Same for targets 1 and 2. And the overdue-percentile
hazard is flat: a column being deep in overdue territory doesn't raise its chance of a 0
next. Our own ranking is sorting on noise — precisely what a memoryless process guarantees.
The filter doesn't actually ask "does each due column hit" — it asks whether the count among
the 6 due columns lands in a window: 2–5 zeros for the due-0 six, 0–3 ones for the due-1
six, 0–1 twos for the due-2 six. So we tested that head-on: does the next draw land in those
windows more often for the due six than a random six? (Baseline is exact — a hypergeometric
that conditions on the draw's own column counts, so there's no sampling noise to hide behind.)
| window | next draw in window — due 6 | random 6 (exact) | difference | p |
|---|---|---|---|---|
2–5 zeros — Joker / Euro |
90.3% / 92.3% | 89.7% / 91.1% | +0.7 / +1.3 pt | 0.17 / 0.20 |
0–3 ones — Joker / Euro |
86.2% / 87.6% | 85.4% / 88.0% | +0.7 / −0.5 pt | 0.22 / 0.68 |
0–1 twos — Joker / Euro |
91.2% / 95.8% | 91.4% / 94.4% | −0.2 / +1.4 pt | 0.66 / 0.062 |
Not one window's "due" version beats random. But look at the capture rates — 86–96%: these windows keep almost every real draw and only trim the extreme tail (a freak all-six-zeros, or two of the rare twos). That's the honest read — the count-window is a gentle, high-recall structural cut; the "due" ranking bolted on top is decorative.
That's not a knock on the function; it does something useful as a descriptive filter (it still shapes the pool's distribution). It just isn't fortune-telling, and it's healthy to prove that on our own code rather than only on the folklore.
Verdict
Across two games, seven tests, and every predictor we could motivate — gap analysis, Markov,
the diagonal, and even the lab's own "due" ranking — the x-overlap columns are memoryless.
You can't name the zero-columns
of the next draw better than a coin that lands on 0 about 54% (Joker) / 58% (Euro) of the time.
And that's not a downer — it's a compass. It tells you where a reduced pool's value can and can't come from:
- Recency / overlap features (
xN, k-delays) → no predictive edge. This is also why those bands drift between draws and have to be re-fit constantly rather than trusted. - Structural / shape features (sum, range, spread, clustering) → these carry the small, honest lift, because real draws aren't spread uniformly across shape-space.
- The minimum-cover ≥4 guarantee → the actual deliverable. It's construction, not fortune-telling.
Test the folklore, keep what survives. Here, the folklore didn't — and the design is better for knowing it.
➡️ Reproduce every number and chart above: xoverlap_memory_test.py
(needs each game's hist_df.csv with st1..st5 and x1..x20).